Insights
Insights is where you see the conversion results of your experience blocks. You can either pop in for a quick overview of progress. Or stick around and drill down for more detail.
How to view Insights
Insights is waiting for you under the Dashboard (click Dashboard if Insights isn’t showing):

This shows a summary of your current Experience blocks. You have set those up first, haven’t you? Until that’s done there won’t be much to see here.
Viewing a block summary
When you arrive in Insights you can see a quick performance summary:

By default this shows:
-
Block name
-
Number of views
-
Conversion rate
-
Author
-
Date last modified
-
First 20 blocks
-
Past 7 days of data (click to view 30 or 90 days’ worth)

To change the default view, click Screen Options:

Viewing deeper block insights
Of course, the summary only gives you, well… a summary of performance. To dive deeper, click on a block. You’ll see something like this:

These three blocks show:
- Block views How many times the block has been viewed by unique visitors
- Conversion rate Calculated by number of conversions divided by total unique views
- Personalisation coverage Percentage of visitors who see the personalised blocks
Block variants
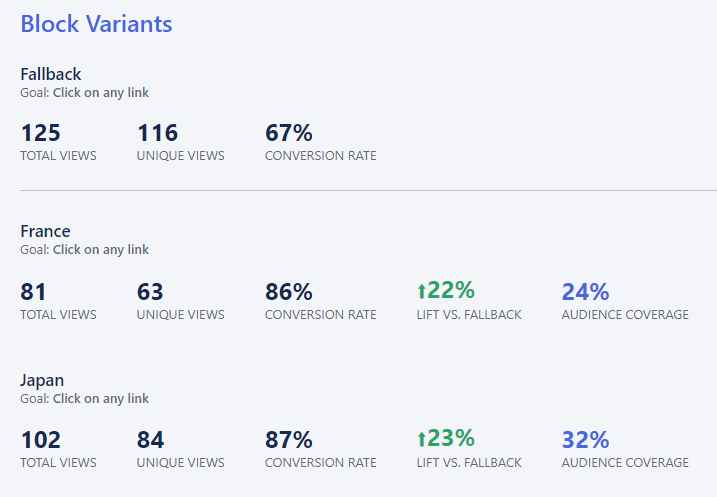
Scroll down and you’ll see a performance breakdown of each block variant.
The example below shows the performance of a block with variants for:
- French audiences
- Japanese audiences
- Fallback (for audiences that aren’t French or Japanese)

This gives you answers to questions like:
- How many visitors viewed each variant?
- How many unique views did we get?
- How does the conversion rate for a variant compare to the fallback?
- What percentage are coming from our specified audiences?